性能是苹果审核的一个很重要的部分,CPU,内存,图形绘制,存储空间和网络性能都是应用的重要的评估和组成部分。不管是作为个人应用开发者还是企业的开发人员,都需要遵循的一个原则是站在用户的角度去思考问题,比如说常见的适配问题,不能因为不同的机型导致最终出现的UI效果差异很大,用户在使用的过程的中最好不要表现出明显的卡顿现象,或者更严重的是出现App闪退,出现闪退的结果就是应用被删,这是属于比较严重的问题。Instruments是目前最强大的性能调试工具之一,有助于我们解决应用存在的性能问题。Instruments是里面包括了内存管理工作,I/O以及网络过去,本文主要讲述的是Allocation和Time Profle。
Allocations(内存分配)
调试之前,我们先来看一个效果图:
就是动态的将文字输出在视图上,下面贴出代码你会发现开始还好运行到慢的简直跟蜗牛有的一拼,不要运行太久,否则内存不够用,代码如下:
@implementation FETextView

- (id)initWithFrame:(CGRect)frame text:(NSString *)text {
    self = [super initWithFrame:frame];
    if (self) {
        [NSTimer scheduledTimerWithTimeInterval:0.01 target:self selector:@selector(appendNextCharacter) userInfo:nil repeats:YES];
        _text = [text copy];
        self.backgroundColor = [UIColor whiteColor];
    }
    return self;
}
//原文地址:Http://www.cnblogs.com/xiaofeixiang
- (void)appendNextCharacter {
    for (NSUInteger i = 0; i <= self.index; i++) {
        if (i < self.text.length) {
            UILabel *label = [[UILabel alloc] init];
            label.text = [self.text substringWithRange:NSMakeRange(i,1)];
            label.opaque = NO;
            [label sizeToFit];
            CGRect frame = label.frame;
            frame.origin = [self originAtIndex:i
                                      fontSize:label.font.pointSize];
            label.frame=frame;
            [self addSubview:label];
        }
    }
    self.index++;
}

- (CGPoint)originAtIndex:(NSUInteger)index
                fontSize:(CGFloat)fontSize {
    if (index == 0) {
        return CGPointZero;
    }
    else {
        CGPoint origin = [self originAtIndex:index-1 fontSize:fontSize];
        NSString *
        prevCharacter = [self.text
                         substringWithRange:NSMakeRange(index-1,1)];
        CGSize
        prevCharacterSize = [prevCharacter
                             sizeWithAttributes:@{ NSFontAttributeName:
                                                       [UIFont systemFontOfSize:fontSize]
                                                   }];
        origin.x += prevCharacterSize.width;
        if (origin.x > CGRectGetWidth(self.bounds)) {
            origin.x = 0;
            origin.y += prevCharacterSize.height;
        }
        return origin;
    }
}
@end
主视图控制器的调用代码:
    NSString *
    path = [[NSBundle mainBundle] pathForResource:@"FlyElephant"
                                           ofType:@"txt"];

    FETextView *textView = [[FETextView alloc]
                           initWithFrame:CGRectMake(0, 64, CGRectGetWidth(self.view.bounds), CGRectGetHeight(self.view.bounds))
                           text:[NSString stringWithContentsOfFile:path
                                                          encoding:NSUTF8StringEncoding
                                                             error:nil]];
    [self.view addSubview:textView];
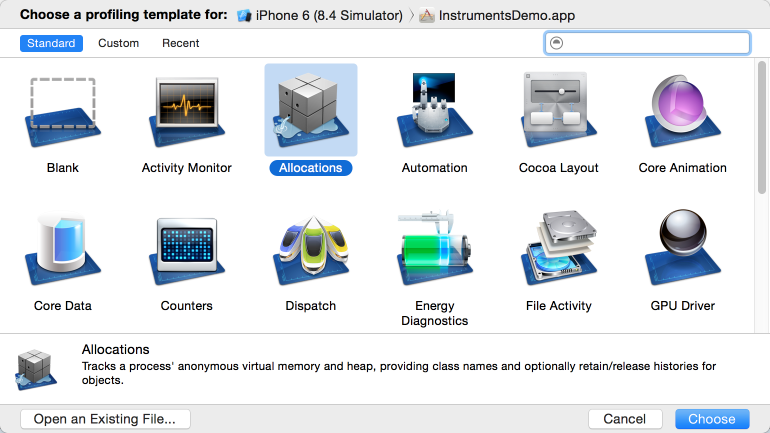
这个时候我们通过Allocation可以进行内存分析,将Xcode切换为Release状态,通过Product→Profile(Cmd+i)找到Allocations:
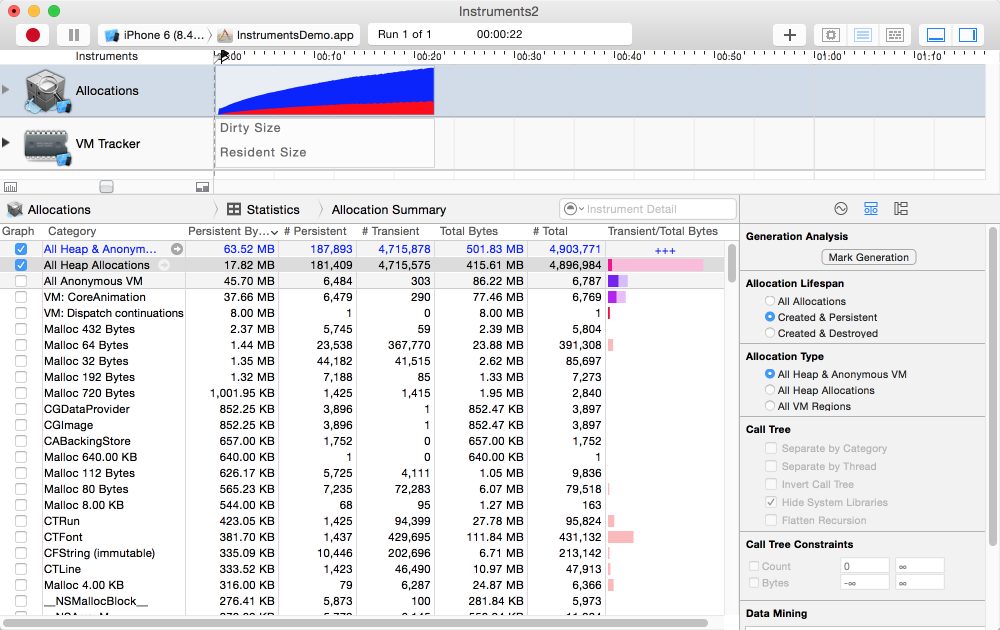
1.红色的按钮是表示停止和启动应用程序,不要理解成了暂停,Objective-C所有的对象都是在堆上分配的,记得勾选一下All Heap Allocations:
2.点击All Heap Allocation,勾选Call Tree,同时不查看系统的函数库:
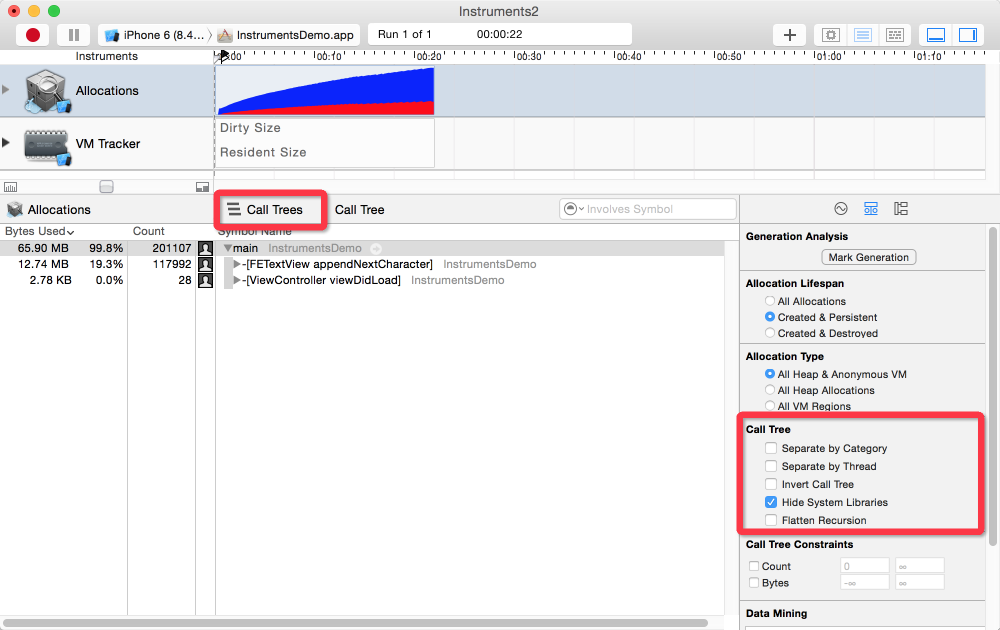
3.具体方法占用的内存,可以逐级点开,效果如下:
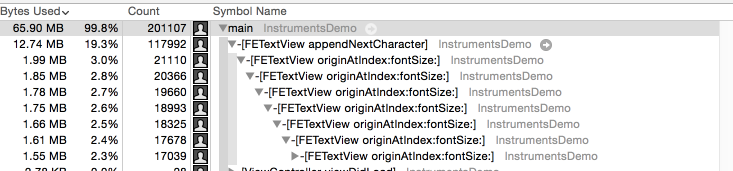
以上是常规的Allocations使用,关于第二张图的有框中的几个选项可以解释一下:
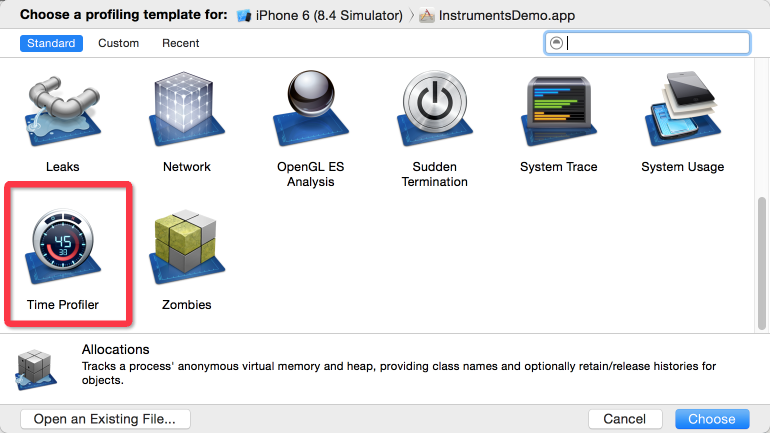
Time Profiler
Time Profiler在Allocations的下方,如图所示:
1.Allocations可以更好查看占用的内存,Time Profiler可以更好查看时间:
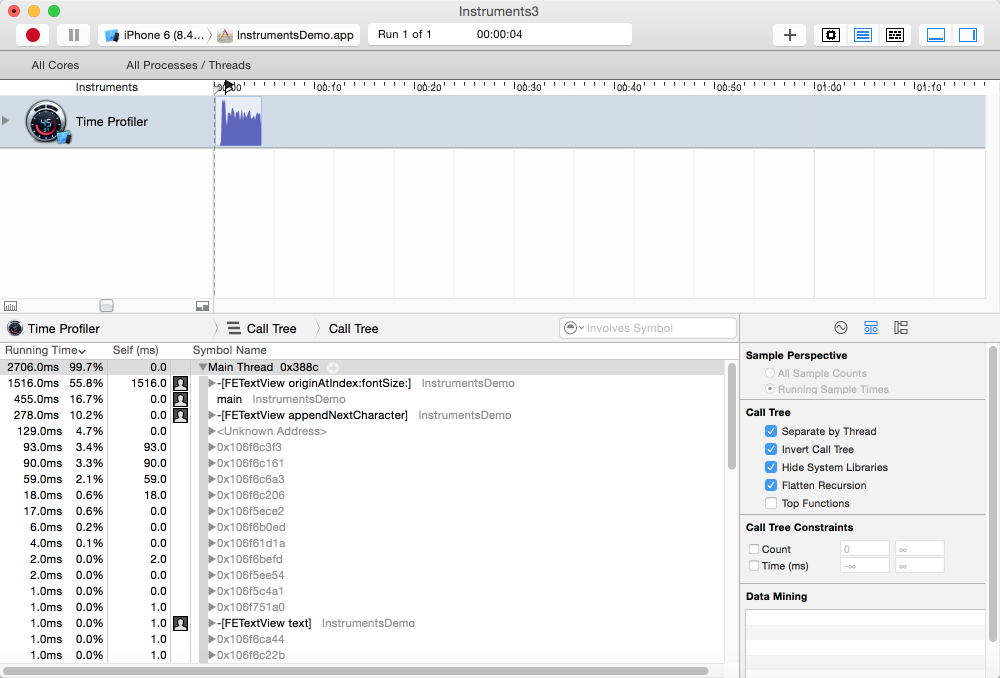
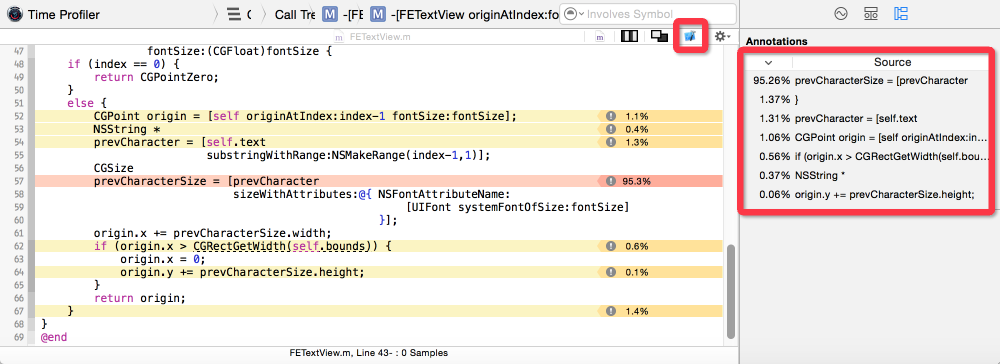
2.点击消耗时间最多的originAtIndex方法,效果如下:
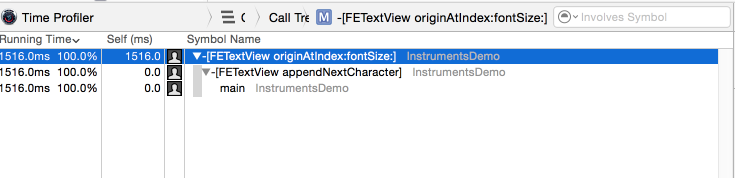
3.查看具体每一行代码的占用时间的百分比,点击Xcode的图标可以进入Xcode中查看代码:
关于Time Profiler的基本用户大概就是这样,关于开发我们还有可能使用到Leak内存泄露工具,基本方法大同小异,关于内存泄露包括两种泄漏:
第一种内存泄漏是指生成的实例对象用完之后不被释放,就会造成内存无法被重新使用;